Help
File list
Jump to navigation
Jump to search
This special page shows all uploaded files.
File list
Items per page:
20
50
100
250
500
Username:
Include old versions of files
Go
First page
Previous page
Next page
Last page
Date
Name
Thumbnail
Size
User
Description
Versions
21:14, 15 December 2016
Chemical.png
(
file
)
426 KB
Matthew Winning
1
21:12, 15 December 2016
Paper.png
(
file
)
413 KB
Matthew Winning
1
21:11, 15 December 2016
Cement.png
(
file
)
382 KB
Matthew Winning
1
21:08, 15 December 2016
Aluminium.png
(
file
)
414 KB
Matthew Winning
1
21:07, 15 December 2016
Steel.png
(
file
)
390 KB
Matthew Winning
1
20:57, 15 December 2016
Households.png
(
file
)
313 KB
Matthew Winning
1
20:09, 15 December 2016
GDP per capita.png
(
file
)
313 KB
Matthew Winning
1
20:01, 15 December 2016
GDPvsSSPs.png
(
file
)
200 KB
Matthew Winning
1
19:50, 15 December 2016
Pop vs SSPs.png
(
file
)
219 KB
Matthew Winning
1
04:49, 9 December 2016
AIMCGE17region.png
(
file
)
Error creating thumbnail: File missing
79 KB
Shinichiro Fujimori
AIM/CGE region
1
05:23, 7 December 2016
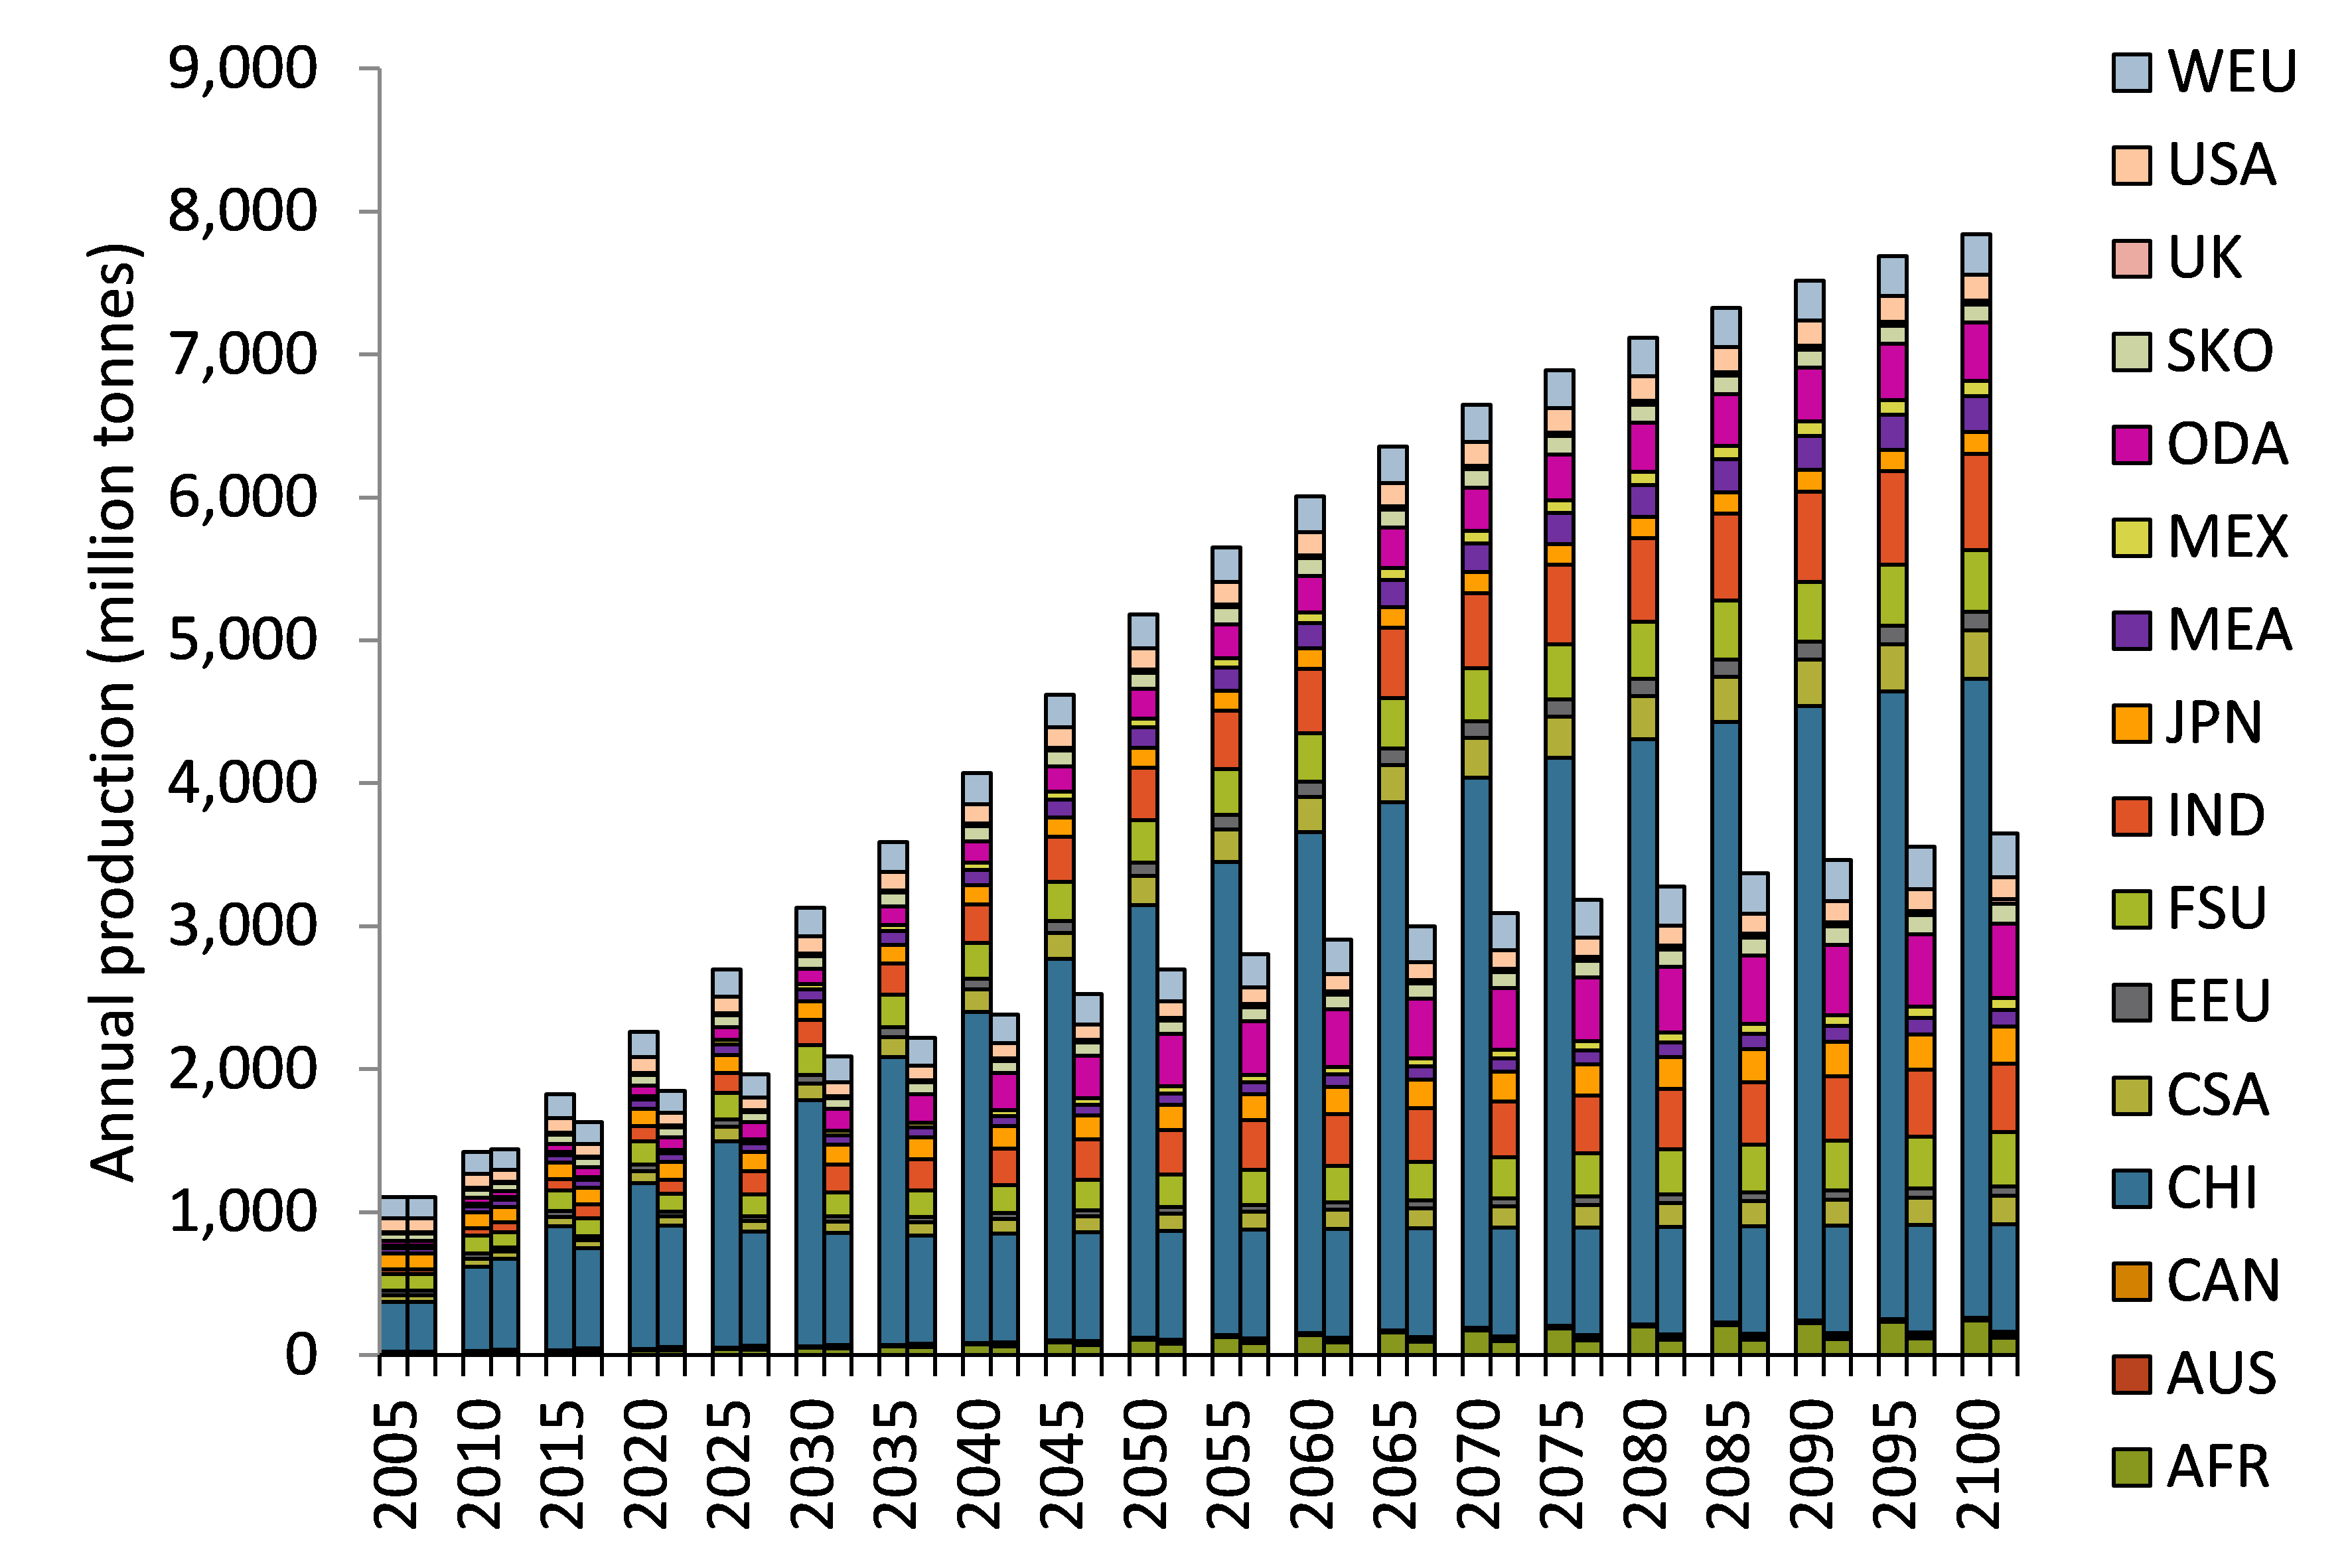
AIMProduction.png
(
file
)
Error creating thumbnail: File missing
654 KB
Shinichiro Fujimori
1
00:34, 21 November 2016
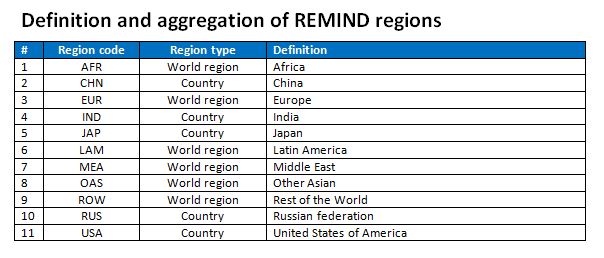
Definition.PNG
(
file
)
14 KB
Laura Delsa
1
00:34, 21 November 2016
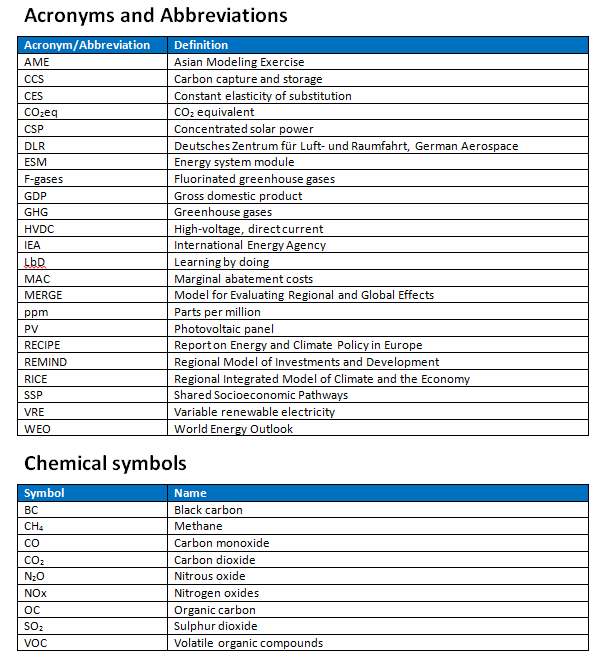
Acronyms.PNG
(
file
)
32 KB
Laura Delsa
1
00:28, 21 November 2016
Water REMIND-MAgPIE 2.PNG
(
file
)
2 KB
Laura Delsa
1
00:25, 21 November 2016
Water REMIND-MAgPIE 1.PNG
(
file
)
2 KB
Laura Delsa
1
00:11, 21 November 2016
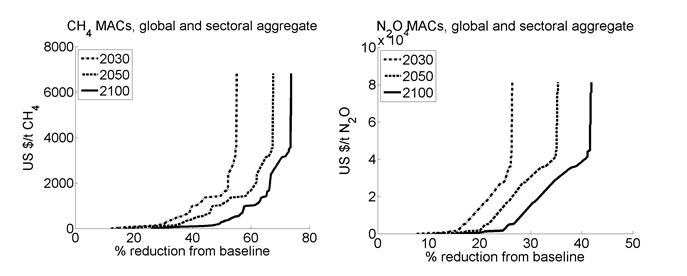
GHGs - REMIND-MAgPIE.PNG
(
file
)
38 KB
Laura Delsa
1
00:01, 21 November 2016
54067656.png
(
file
)
72 KB
Laura Delsa
2
23:39, 20 November 2016
Table 8 Remind.PNG
(
file
)
5 KB
Laura Delsa
1
23:33, 20 November 2016
36405422.jpg
(
file
)
3 KB
Laura Delsa
2
23:29, 20 November 2016
Heat REMIND-MAgPIE.PNG
(
file
)
20 KB
Laura Delsa
1
23:11, 20 November 2016
Table 3 Remind.PNG
(
file
)
5 KB
Laura Delsa
1
23:08, 20 November 2016
Non-biomass renewables REMIND-MAgPIE.PNG
(
file
)
124 KB
Laura Delsa
4
22:46, 20 November 2016
Figure Fossil energy resources REMIND-MAgPIE.png
(
file
)
54 KB
Laura Delsa
3
17:25, 20 November 2016
REMIND-MAgPIE production structure 2.png
(
file
)
182 KB
Laura Delsa
2
16:50, 20 November 2016
Figure REMIND-MAgPIE production structure.JPG.jpg
(
file
)
82 KB
Laura Delsa
1
16:28, 20 November 2016
Figure Socio-economic drivers - REMIND-MAgPIE.JPG
(
file
)
27 KB
Laura Delsa
1
16:51, 24 October 2016
16 Flow chart of the environmental module.jpg
(
file
)
35 KB
Leonidas Paroussos
1
14:00, 21 October 2016
Figure 15 Households’ transport demand nesting scheme.gif
(
file
)
5 KB
Leonidas Paroussos
2
13:19, 21 October 2016
Cameron et al image3.jpg
(
file
)
160 KB
Johanna Zilliacus
1
13:13, 21 October 2016
Cameron et al image2.jpg
(
file
)
146 KB
Johanna Zilliacus
1
12:58, 21 October 2016
Figure 14 Nesting scheme for the choice of transport modes in production functions of business sectors.gif
(
file
)
9 KB
Leonidas Paroussos
1
12:56, 21 October 2016
Figure 1 Upper levels of the nesting scheme in production functions of business sectors.gif
(
file
)
10 KB
Leonidas Paroussos
3
12:41, 21 October 2016
Cameron et al image1.jpg
(
file
)
48 KB
Johanna Zilliacus
1
12:06, 21 October 2016
Figure 10 Illustration of equilibrium unemployment.gif
(
file
)
11 KB
Leonidas Paroussos
1
12:00, 21 October 2016
Figure 9 Production nesting scheme in the GEM-E3 model - Refineries.gif
(
file
)
9 KB
Leonidas Paroussos
1
12:00, 21 October 2016
Figure 8 Production nesting scheme in the GEM-E3 model - Power producing technologies.gif
(
file
)
4 KB
Leonidas Paroussos
1
11:59, 21 October 2016
Figure 7 Production nesting scheme in the GEM-E3 model - Electricity supply.gif
(
file
)
8 KB
Leonidas Paroussos
1
11:58, 21 October 2016
Figure 6 Production nesting scheme in the GEM-E3 model - Resource sectors.png
(
file
)
15 KB
Leonidas Paroussos
1
11:58, 21 October 2016
Figure 5 Production nesting scheme in the GEM-E3 model - Non energy sectors.gif
(
file
)
8 KB
Leonidas Paroussos
1
11:57, 21 October 2016
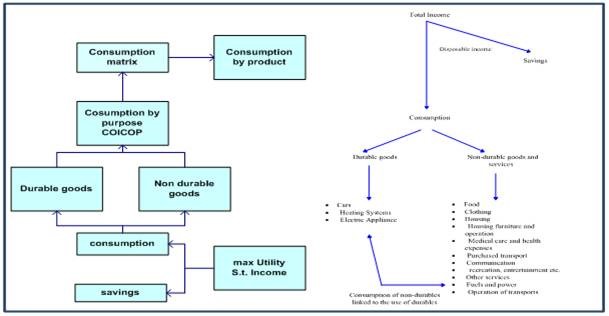
Figure 4 The consumption structure of the GEM-E3 model.jpg
(
file
)
31 KB
Leonidas Paroussos
1
11:48, 21 October 2016
Figure 3 Investment decisions of firms.gif
(
file
)
16 KB
Leonidas Paroussos
2
11:40, 21 October 2016
Figure 2 Steps for scenario simulation in GEM-E3.gif
(
file
)
18 KB
Leonidas Paroussos
2
11:38, 21 October 2016
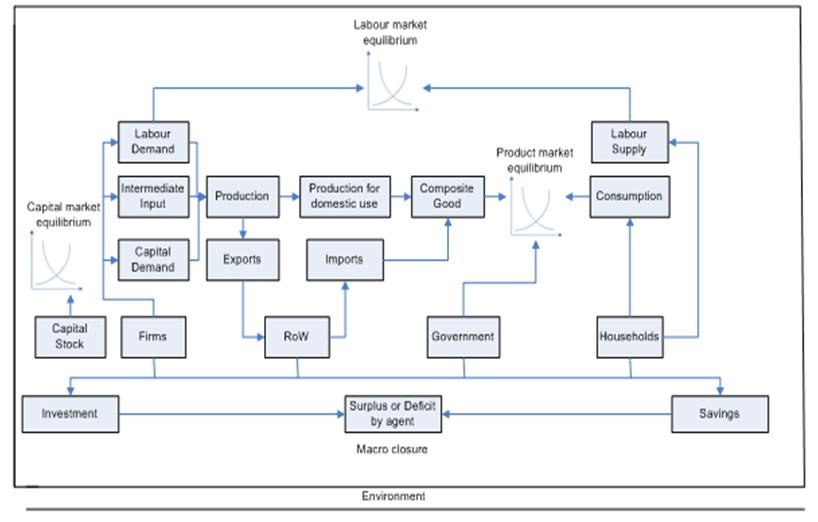
Figure 1 GEM-E3 economic circuit.jpg
(
file
)
55 KB
Leonidas Paroussos
1
10:29, 21 October 2016
Fricko et al image2.jpg
(
file
)
373 KB
Johanna Zilliacus
1
10:19, 21 October 2016
Fricko et al image1.jpg
(
file
)
948 KB
Johanna Zilliacus
1
17:20, 20 October 2016
Rao et al fig2.jpg
(
file
)
155 KB
Johanna Zilliacus
1
16:21, 20 October 2016
Power-technologies.png
(
file
)
31 KB
Kimon Keramidas
Electricity production technologies in POLES
1
16:00, 20 October 2016
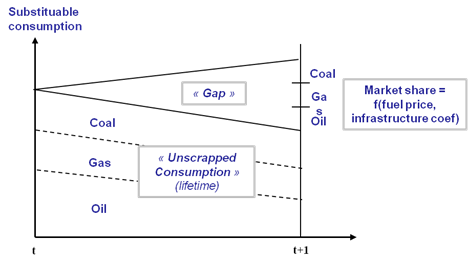
Scrap-gap.png
(
file
)
23 KB
Kimon Keramidas
Schematic of the energy needs and depreciation procedure in POLES
1
19:01, 19 October 2016
Figure 3 Households’ transport demand nesting scheme.gif
(
file
)
5 KB
Leonidas Paroussos
1
18:38, 19 October 2016
Figure 2 Nesting scheme for the choice of transport modes in production functions of business sectors.gif
(
file
)
9 KB
Leonidas Paroussos
1
First page
Previous page
Next page
Last page
Navigation menu
Personal tools
Log in
Namespaces
Special page
English
Views
More
Search
Navigation
IAMC wiki
Model documentation
AIM-Hub
BLUES
C3IAM
COFFEE-TEA
DNE21+
GCAM
GEM-E3
GRACE
IFs
IMACLIM
IMAGE
MESSAGE-GLOBIOM
POLES
PROMETHEUS
REMIND-MAgPIE
TIAM-UCL
WITCH
Archived model versions
Reference card
AIM-Enduse India
AIM-Enduse Japan
AIM-Hub
AIM-Hub Thailand
AIM-Hub Viet Nam
BET
BLUES
China TIMES
C3IAM
COFFEE-TEA
DART
DNE21+
E3ME-FTT
ENV-Linkages
EPPA
Euro-Calliope
GCAM
GCAM-KSA
GEM-E3
GENeSYS-MOD
GMM
GRACE
ICES
IFs
IMACLIM
IMACLIM-NLU
IMACLIM-India
IMAGE
IPAC-AIM technology
IPAC-Global
IPETS
MARKAL-India
MERGE-ETL
MESSAGE-GLOBIOM
MESSAGE Korea
MIGRATION
MUSE
POLES
PRIMES
PROMETHEUS
REMIND-MAgPIE
REMod
RICE50+
SNOW_GL _HH
TIAM-ECN
TIAM-UCL
TIMES-France
VESPA
WEGDYN
WITCH
WITNESS
Model diagnostics
Introduction
IMAGE
Overviews
Reference card overviews
Model comparison
Model comparison based on scope and methods
Export reference card data (matrix format)
Export reference card data (database format)
Model inputs
AIM-Hub
GCAM
IMAGE
MESSAGE-GLOBIOM
REMIND-MAgPIE
WITCH
Tools
Special pages
Printable version


