Model scope and methods - IMAGE
| Corresponding documentation | |
|---|---|
| Previous versions | |
| Model information | |
| Model link | |
| Institution | PBL Netherlands Environmental Assessment Agency (PBL), Netherlands, https://www.pbl.nl/en. |
| Solution concept | Partial equilibrium (price elastic demand) |
| Solution method | Simulation |
| Anticipation | Simulation modelling framework, without foresight. However, a simplified version of the energy/climate part of the model (called FAIR) can be run prior to running the framework to obtain data for climate policy simulations. |
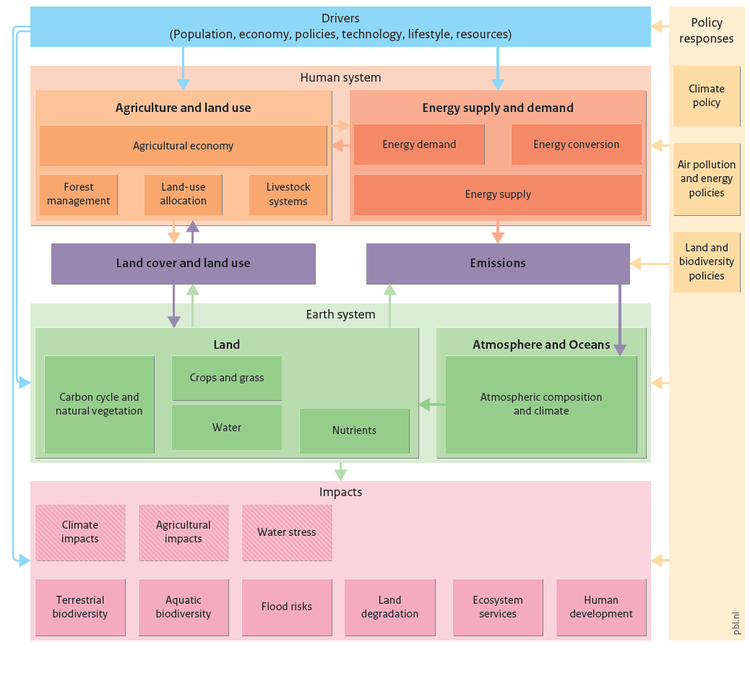
The components of the IMAGE framework are presented in Figure 1, which also shows the information flow from the key driving factors to the impact indicators. Future pathways or scenarios depend on the assumed projections of key driving forces. Thus, all results can only be understood and interpreted in the context of the assumed future environment in which they unfold. As a result of the exogenous drivers, IMAGE projects how human activities would develop, in particular in the energy and agricultural systems. Human activities and associated demand for ecosystem services are squared to the Earth system through the interconnectors Land Cover and Land Use, and Emissions.
Assumed policy interventions lead to model responses, taking into account all internal interactions and feedback. Impacts in various forms arise either directly from the model, for example the extent of future land-use for agriculture and forestry, or the average global temperature increase up to 2050. Other indicators are generated by activating additional models that use output from the core IMAGE model, together with other assumptions to estimate the effects, for example, biodiversity (GLOBIO) and flood risks. Currently, impacts emerging from additional models do not influence the outcome of the model run directly. The results obtained can reveal unsustainable or otherwise undesirable impacts, and induce exploration of alternative model assumptions to alleviate the problem. As the alternative is implemented in the linked models, synergies and trade-offs against other indicators are revealed.
To apply IMAGE 3.0, all model settings are adjusted so that the model reproduces the state-of-the-world in 2005. The model calculates the state in 2005 over the period starting in 1970, using exogenous data to calibrate internal parameters. From 2005 onwards, a range of model drivers rooted in more generic narratives and scenario drivers must be prepared either by experts or teams at PBL or in partner institutes to provide inputs, such as population and economic projections. These steps are taken in consultation with stakeholders and sponsors of the studies, and with project partners. An IMAGE run produces a long list of outputs representing the results of the various parts of the framework, either as end indicator or as intermediate inputs driving operations further downstream. Together the outputs span the range from drivers to pressures, states and impacts.
The IMAGE 3.0 model has a wide range of outputs, including:
- energy use, conversion and supply;
- agricultural production, land cover and land use;
- nutrient cycles in natural and agricultural systems;
- emissions to air and surface water;
- carbon stocks in biomass pools, soils, atmosphere and oceans;
- atmospheric emissions of greenhouse gases and air pollutants;
- concentration of greenhouse gases in the atmosphere and radiative forcing;
- changes in temperature and precipitation;
- sea level rise;
- water use for irrigation.
These standard outputs are complemented with additional impact models with indicators for biodiversity, human development, water stress, and flood risks.
