Model concept, solver and details - IFs
| Corresponding documentation | |
|---|---|
| Previous versions | |
| Model information | |
| Model link | |
| Institution | Frederick S. Pardee Center for International Futures, University of Denver (Pardee Center), Colorado, USA, https://pardee.du.edu/. |
| Solution concept | |
| Solution method | Dynamic recursive with annual time steps through 2100. |
| Anticipation | Myopic |
International Futures (IFs) is a large-scale, long-term, integrated global modeling system. The system is dynamic recursive with 1-year time steps, normally through 2100, but with capacity for extended analysis through 2200.
IFs is a tool for thinking about long-term global trends and strategic planning for the future. Among the unique features of the system is the extensive integration of models across human capacity, social, and natural systems. IFs contains highly integrated (hard-linked) models across demographic, economic, education, health, governance, agriculture, energy, infrastructure, water, climate and other subsystems for 188 countries/political units interacting in the global system. The central purpose of IFs is to facilitate exploration of global futures through alternative scenarios.
IFs can help a user
- Understand the state of major global systems
- Explore long-term trends and consider where they might take us
- Learn about the dynamic interactions across global subsystems
- Clarify long-term organizational goals/priorities
- Develop alternative scenarios (if-then statements) about the future
- Investigate how different agent categories (households, firms and governments) can shape the future
IFs is integrated with a large database (nearly 7,000 series) for its countries, most of which include data since 1960. The system is fully imbedded in an interactive interface, and it is both open source and freely available to users both on-line at https://www.ifs.du.edu/ifs/frm_MainMenu.aspx and in downloadable form at https://korbel.du.edu/pardee/content/download-ifs. The interface facilitates data analysis, projection exploration and comparison, and flexible scenario analysis.
The models of IFs and their interactions
Figure 2 shows one representation of the major hard-linked models within the IFs system; the models each have multiple subcomponents that can be aggregated in various ways in such a diagram. Thus alternative portrayals of the total system in such diagrams vary somewhat.
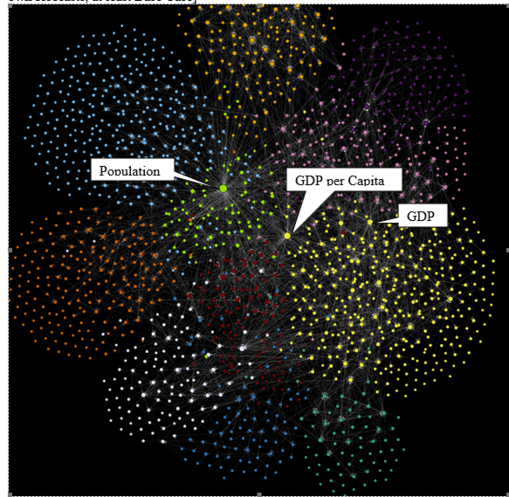
Ongoing development and use of IFs directs much attention to the full range of the Sustainable Development Goals (SDGs). Thus the color-coding of the representation of the IFs system in Figure 2 corresponds very crudely to the subsets that correspond to human development SDGs (green models), to socio-economic and to some degree more instrumental SDGs (blue), and to physical system sustainability SDGs (black), Clearly, however, that coloring scheme is extremely crude because the pursuit of all SDGs is greatly affected by demographic (notably Population) and economic (notably GDP and GDP per capita) variables, as suggested by their size and hence centrality in the network diagram for IFs of Figure 3. Again, the full set of models and interactions facilitate broad analysis of SDG pursuit and other analyses.
The multistate demographic model uses a standard cohort-component representation. Fertility and mortality are endogenous in response to other drivers, including adult educational attainment from a full education model and 15 categories of mortality and morbidity from a health model. In the education model students flow by grade through primary, lower secondary upper secondary, and tertiary levels. In the health model, mortality and morbidity are age and sex specific.
The multisector economic model is general equilibrium, although the model uses changes in inventory stocks and relative prices to drive changes in supply and demand, chasing equilibrium over time rather than solving for it or iterating to it in every time cycle. This is consistent with actual market behavior and also facilitates computational efficiency. The partial equilibrium physical agriculture model differentiates crop, meat and fish and generates calorie and protein availability. The partial equilibrium energy model differentiates coal, oil, natural gas, hydroelectric power, nuclear power, solar, wind, geothermal, and other renewable energy, tracking resources bases and production. Key variables from the agriculture and energy models, converted to monetary terms, override those of the same sectors in the economic model, while the integration across sectors in the economic model of variables including household, government and firm demand and savings/investment availability provides information to and constraints upon the physical models.
The physical agriculture and energy models determine land use and generate carbon emissions. A representation based on the MAGICC model, used widely in IAMs. connects carbon emissions to atmospheric levels, global warming, and country-level changes in temperature and precipitation. Those feed forward to the agriculture model with a mixture of potentially positive and negative consequences There are also water (not shown separately in Figure 2) and infrastructure models. The water model represents supply from renewable and nonrenewable sources and demand for agricultural, municipal and industrial uses. Agricultural water use is linked to irrigation in the agriculture model and can constrain yields. The infrastructure model represents extent of and access to paved roads, safe water and sanitation, electricity, and information and communication technologies. It requires investment from public and private sectors that compete with demand from the education and health models, as well as other uses.
There are also water (not shown separately in Figure 2) and infrastructure models. The water model represents supply from renewable and nonrenewable sources and demand for agricultural, municipal and industrial uses. Agricultural water use is linked to irrigation in the agriculture model and can constrain yields. The infrastructure model represents extent of and access to paved roads, safe water and sanitation, electricity, and information and communication technologies. It requires investment from public and private sectors that compete with demand from the education and health models, as well as other uses.
Across the broader IFs system and well beyond the GDP and population variables, two aspects are especially important in the interaction of the separate models. The first is finance, including governmental revenues and expenditures, but also those of households and firms. The economic system is imbedded within a full social accounting matrix that represents all financial flows within and across these agent categories and assures that representation of those flows is appropriately balanced and constrained—there are thus no free lunches in scenario analysis representing pursuit of alternative futures including attention to the SDGs. The second area where models in the IFs system are especially interactive is via the endogenous representation of productivity in the economic model. Multifactor (or total factor) productivity is responsive to changes in human capital (education and health), social capital (including governance quality), physical capital (including infrastructure development), and knowledge capital (including research and development spending but also the knowledge imbedded in trade among countries). See the Macro-economy topic.
A broader model of governance represents the state of domestic security or instability, corruption, and inclusion (democracy) and connects to government finance. Socio-political variables also trace change in basic value/cultural structures, and portray various elements of formal and informal socio-economic structures and processes, including income distribution. The IFs system also represents changes in country power positions and relationships globally (drawing especially on economic, population, and technology variables), a foundation of international politics and potentially of capability for collective global action.
Technological change is important across most of the models in IFs. While exogenously represented in many instances, the production functions in the economic, agriculture, and energy models have elements of learning by doing.
This brief summary only touches on the model structure and interconnections; for more extensive coverage see Hughes (2019 forthcoming) and the IFs project Wiki (http://pardee.du.edu/wiki/Main_Page).
The interactive interface of IFs and analysis with the system. Because IFs is dynamic recursive and computationally efficient, scenario development and exploration with it can be interactive. The completion of a single run (Version 8.35) with the system through 2100 requires less than 8 minutes with the “stand-alone” version on a fast laptop or 3 minutes on the project’s own server, where it is available for use by anyone.
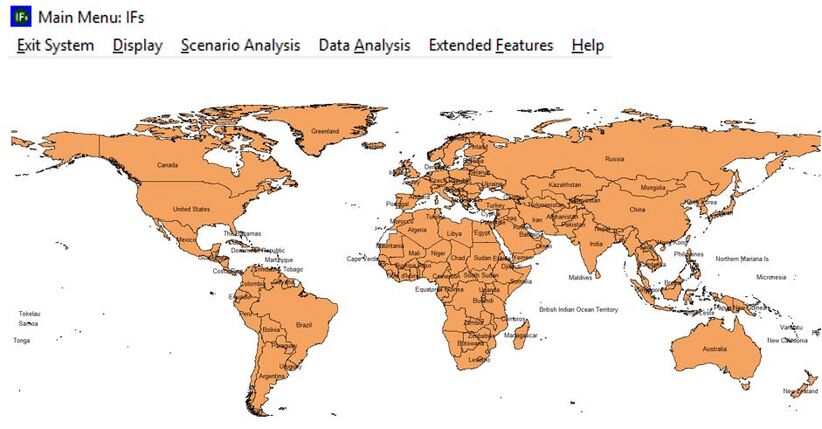
Figure 4 shows the main screen for interaction with the system in the stand-alone version. Leaving aside Extended Features (which the IFs Wiki documents in some detail), there are three major functionalities in the main menu, each of which lead into a great many sub-options:
- Data analysis. This functionality allows interaction with the more than 4,000 data series packaged with IFs, including display on maps as well as both displays and statistical exploration longitudinally and in cross-sectional analysis.
- Display. This functionality facilitates standard graphical and tabular representations from the Base Case and other scenarios of IFs, using any combination of individual countries or country groupings. At the most detailed level, one form of display (Self-Managed) can call up any variable or parameter in the system. There is also a very extensive set of prepackaged displays described in natural language that contain most of the variables in the model individually or in combination, often in combination with historical series for the same variable(s). In addition, the Display functionality includes a wide selection of specialized displays including age-sex population graphics for population alone or overlaid with educational attainment or mortality rates, analysis of contributions of multiple drivers of economic growth, and both overview and drill down capability on a wide range of indicators across the Sustainable Development Goals.
- Scenario analysis. This functionality provides access to all parameters and initial conditions in IFs. For temporally specific parameter changes, it supports interpolation or even year-by-year specification. Users can save collections of parameter changes into scenario specification files for further future editing and can use the specification files at any time to create scenario run files for analysis and comparison via the display functionality. A large library of saved scenario specification files exists for users, including representation of the Shared Socioeconomic Pathways (SSPs) and scenarios representing policy directions for accelerated pursuit of the Sustainable Development Goals (SDGs). Important: The user of IFs can run multiple scenarios either in batch mode or individually, saving all of the results from the run (all model parameters and variables) in run files; the Display features then allows extensive comparison of scenario assumptions and results.


