Industrial sector - TIAM-UCL: Difference between revisions
No edit summary |
No edit summary |
||
| (One intermediate revision by the same user not shown) | |||
| Line 6: | Line 6: | ||
== Energy-service demands == | == Energy-service demands == | ||
The industrial sector is characterized by 6 demand segments, each representing either the physical output of the industry or the total energy requirement ('''Table 3.5.1)'''. There are also one demand for 'Other non-specified energy consumption (ONO)', one for 'Industrial and Other non-energy uses (NEO)' and one for 'Other Industrial consumption ( | The industrial sector is characterized by 6 demand segments, each representing either the physical output of the industry or the total energy requirement ('''Table 3.5.1)'''. There are also one demand for 'Other non-specified energy consumption (ONO)', one for 'Industrial and Other non-energy uses (NEO)' and one for 'Other Industrial consumption (I0I)', which are considered as a generic demands. The last one (I0I) has been added for minor calibration purposes and is generally not used. There are different technologies and fuels modelled for supplying steam, process heat, machine drives and electro-chemical process for each energy-service demand in the Base-year templates. | ||
'''Table 3.5.1: Industry sector energy-services''' | '''Table 3.5.1: Industry sector energy-services''' | ||
| Line 13: | Line 13: | ||
| Code || Energy-service demand || Unit | | Code || Energy-service demand || Unit | ||
|- | |- | ||
| | | I0I || Other Industrial consumption || PJ | ||
|- | |- | ||
| ICH || Chemicals || PJ | | ICH || Chemicals || PJ | ||
| Line 40: | Line 40: | ||
'''Figure 3.5.1: projected industry sector energy-service demands at global level''' | '''Figure 3.5.1: projected industry sector energy-service demands at global level''' | ||
There are hundreds of technologies modelled in the industry sector to meet the energy-service demands. For each energy-services of each industry, a number of existing technologies are in competition to satisfy energy-service demand. They are characterized by an efficiency, an annual utilization factor, a lifetime, operation costs, and six seasonal share coefficients (summer-day, summer-night, intermediary day, intermediary-night, winter-day, winter-night). The technologies included in the Base-Year template are the existing technologies to meet the base-year demand and the residual capacities can be used till end of their life period. No new investments are allowed in the existing technologies in any sector. . These technologies progressively replace the existing ones and they are characterized by the same type of parameters such as efficiency, and investment cost. Regional specific hurdle rates are applies to industry sector new technologies as shown in '''Figure 3.5.2'''. It varies from 10% (developed countries) to 20% (least developed countries). | There are hundreds of technologies modelled in the industry sector to meet the energy-service demands. For each energy-services of each industry, a number of existing technologies are in competition to satisfy energy-service demand. They are characterized by an efficiency, an annual utilization factor, a lifetime, operation costs, and six seasonal share coefficients (summer-day, summer-night, intermediary day, intermediary-night, winter-day, winter-night). The technologies included in the Base-Year template are the existing technologies to meet the base-year demand and the residual capacities can be used till end of their life period. No new investments are allowed in the existing technologies in any sector. . These technologies progressively replace the existing ones and they are characterized by the same type of parameters such as efficiency, and investment cost. Regional specific [http://themasites.pbl.nl/models/advance/index.php/Energy_-_TIAM-UCL hurdle rates] are applies to industry sector new technologies as shown in '''Figure 3.5.2'''. It varies from 10% (developed countries) to 20% (least developed countries). | ||
[[File:35815694.png]] | [[File:35815694.png]] | ||
'''Figure 3.5.2: Regional specific hurdle rate for industry sector technologies''' | '''Figure 3.5.2: Regional specific hurdle rate for industry sector technologies''' | ||
Latest revision as of 20:14, 14 December 2016
| Corresponding documentation | |
|---|---|
| Previous versions | |
| Model information | |
| Model link | |
| Institution | University College London (UCL), UK, https://www.ucl.ac.uk. |
| Solution concept | Partial equilibrium (price elastic demand) |
| Solution method | Linear optimisation |
| Anticipation | Perfect Foresight
(Stochastic and myopic runs are also possible) |
Energy-service demands
The industrial sector is characterized by 6 demand segments, each representing either the physical output of the industry or the total energy requirement (Table 3.5.1). There are also one demand for 'Other non-specified energy consumption (ONO)', one for 'Industrial and Other non-energy uses (NEO)' and one for 'Other Industrial consumption (I0I)', which are considered as a generic demands. The last one (I0I) has been added for minor calibration purposes and is generally not used. There are different technologies and fuels modelled for supplying steam, process heat, machine drives and electro-chemical process for each energy-service demand in the Base-year templates.
Table 3.5.1: Industry sector energy-services
| Code | Energy-service demand | Unit |
| I0I | Other Industrial consumption | PJ |
| ICH | Chemicals | PJ |
| IIS | Iron and Steel | Mt |
| ILP | Pulp and Paper | Mt |
| INF | Non-ferrous metals | Mt |
| INM | Non Metals | PJ |
| NEU | Other Industries | PJ |
| NEO | Industrial and Other Non Energy Uses | PJ |
| ONO | Other non-specified consumption | PJ |
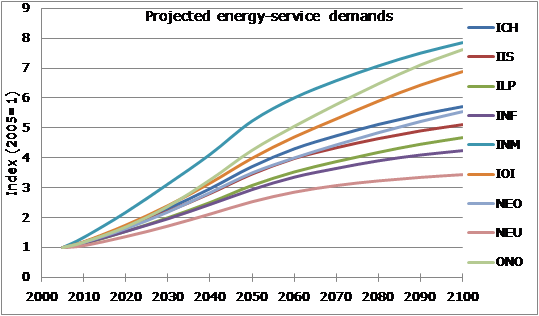
Energy service demands are projected to 2100 using general economic and demographic drivers population, GDP, GDP per capita and sectoral output). To develop projections of future energy service demands, estimates of drivers are used in conjunction with user assumptions on the topic of service demand sensitivity to these drivers. Projected industry sector energy-service demands at a global level are presented in Figure 3.5.1. Similar tables have been generated for each region. Industry sector has relatively high growth in China as compared to other regions.
Figure 3.5.1: projected industry sector energy-service demands at global level
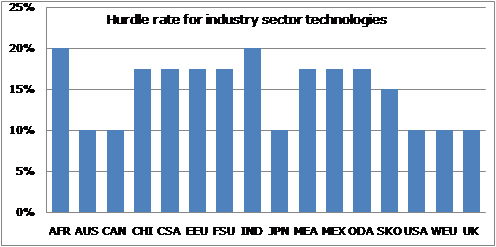
There are hundreds of technologies modelled in the industry sector to meet the energy-service demands. For each energy-services of each industry, a number of existing technologies are in competition to satisfy energy-service demand. They are characterized by an efficiency, an annual utilization factor, a lifetime, operation costs, and six seasonal share coefficients (summer-day, summer-night, intermediary day, intermediary-night, winter-day, winter-night). The technologies included in the Base-Year template are the existing technologies to meet the base-year demand and the residual capacities can be used till end of their life period. No new investments are allowed in the existing technologies in any sector. . These technologies progressively replace the existing ones and they are characterized by the same type of parameters such as efficiency, and investment cost. Regional specific hurdle rates are applies to industry sector new technologies as shown in Figure 3.5.2. It varies from 10% (developed countries) to 20% (least developed countries).
Figure 3.5.2: Regional specific hurdle rate for industry sector technologies

