Other end-use - TIAM-UCL: Difference between revisions
No edit summary |
No edit summary |
||
| (2 intermediate revisions by the same user not shown) | |||
| Line 8: | Line 8: | ||
=== Energy services demand === | === Energy services demand === | ||
Energy-service demand in the agricultural sector is represented by a single demand segment and projected using the driver 'agricultural sector output', which is based on GDP per capita and population, for each region. '''Figure 3.6.1''' presents the projected energy-service demand by region. Note that there are no new technologies associated with the generic demand (AGR). In this sector, it is assumed that increases in agricultural output result in proportionate increases in energy input. | |||
[[File:35815695.png]] | [[File:35815695.png]] | ||
Latest revision as of 20:24, 14 December 2016
| Corresponding documentation | |
|---|---|
| Previous versions | |
| Model information | |
| Model link | |
| Institution | University College London (UCL), UK, https://www.ucl.ac.uk. |
| Solution concept | Partial equilibrium (price elastic demand) |
| Solution method | Linear optimisation |
| Anticipation | Perfect Foresight
(Stochastic and myopic runs are also possible) |
Agriculture
Energy services demand
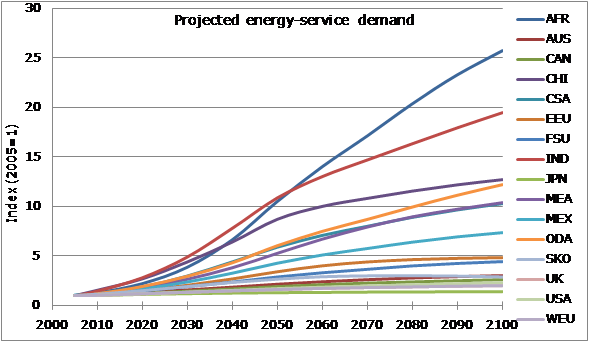
Energy-service demand in the agricultural sector is represented by a single demand segment and projected using the driver 'agricultural sector output', which is based on GDP per capita and population, for each region. Figure 3.6.1 presents the projected energy-service demand by region. Note that there are no new technologies associated with the generic demand (AGR). In this sector, it is assumed that increases in agricultural output result in proportionate increases in energy input.
Figure 3.6.1: Agriculture energy-service demand projection by region
Sector fuels
Sectoral fuel technologies are modelled in the sheet AGR_Fuels in the residential Base-Year template as shown in Table 3.6.1. The fuels are aggregated into 13 categories consumed in the agriculture sector. Aggregation ratios are based on data provided by the IEA database. The technologies created to produce aggregated fuels (Fuel Tech) are named uniformly using the name of the aggregated fuels as specified in the column Commodity OUT plus three zero (000 for existing technology in the base-year). Their description changes according to the fuel (e.g. Fuel Tech - Coal (AGR) or Fuel Tech - Natural Gas (AGR). The fractional shares of the disaggregated fuels (Commodity IN) used to produce an aggregated fuel (Commodity OUT) are calculated from their consumption over the total for this category, as given in the IEA database.
Table 3.6.1: Agriculture sector fuel technologies-existing
| Technology Description |
| Fuel Tech - Natural Gas Mix (AGR) |
| Fuel Tech - Natural Gas (AGR) |
| Fuel Tech - Diesel (AGR) |
| Fuel Tech - Gasoline (AGR) |
| Fuel Tech - Heavy Fuel Oil (AGR) |
| Fuel Tech - Kerosene (AGR) |
| Fuel Tech - Coal (AGR) |
| Fuel Tech - Liquified Petroleum Gases (AGR) |
| Fuel Tech - Biofuels (AGR) |
| Fuel Tech - Geothermal (AGR) |
| Fuel Tech - Solar (AGR) |
| Fuel Tech - Electricity (AGR) |
| Fuel Tech - Heat (AGR) |
Base-year calibration
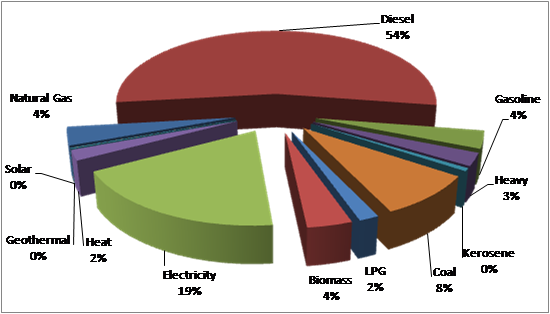
IEA energy balance provides agriculture energy consumption by fuels. Since agriculture sector is defined with a single energy-service, there is no need for that split of fuel consumptions into different sub-sector as we did for other end-use sector. Fuels in the IEA energy balance has been aggregated into 13 fuels (commodity) as defined in the sector fuel table (Table 3.6.1). The energy mix of Base-year global agriculture final energy consumption (7,283 PJ) is presented in Figure 3.6.2 at a global level.
Figure 3.6.2: Base-year agriculture energy consumption mix by fuel

