Electricity - TIAM-UCL
| Corresponding documentation | |
|---|---|
| Previous versions | |
| Model information | |
| Model link | |
| Institution | University College London (UCL), UK, https://www.ucl.ac.uk. |
| Solution concept | Partial equilibrium (price elastic demand) |
| Solution method | Linear optimisation |
| Anticipation | Perfect Foresight
(Stochastic and myopic runs are also possible) |
Conversion
The electricity and heat generation sector represents many different technology types, using a wide range of fossil-based and renewables resources. The existing system is represented in generic terms whilst the options for future investments are characterised in more detail. Annual electricity and heat supply is temporally disaggregated across six periods (or time slices), based on three season and two diurnal periods (Day / night) to represent changes in load based on sector demand profiles.
Electricity generation plant are additionally categorised as providing electricity to the centralised or decentralised grid (CEN or DCN). Decentralised producers tend to be small scale, connected to the distribution network or serving local grids, and produce one commodity in the model while centralised producers, connected to transmission network, produce a seperate commodity.
The electricity sector Base-Year template is used to calibrate the base-year electricity and heat generation. In the Base-Year template (providing information on existing plant), characterisation of plants is fairly generic, with all production of electricity categorised as ELC-CEN. Off-grid production (via micro-generation technologies) is not explicitly captured in the model, with small-scale generation represented in the decentralised producer group.
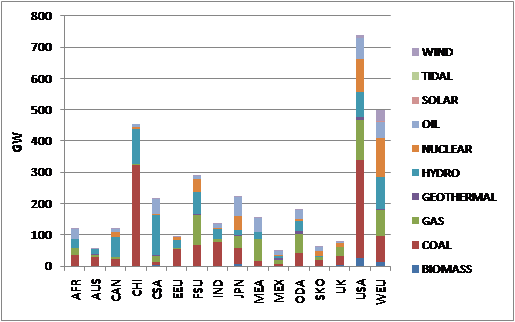
Figure: Existing Electricity Generation Capacity by Region in 2005 (Model base year), GW
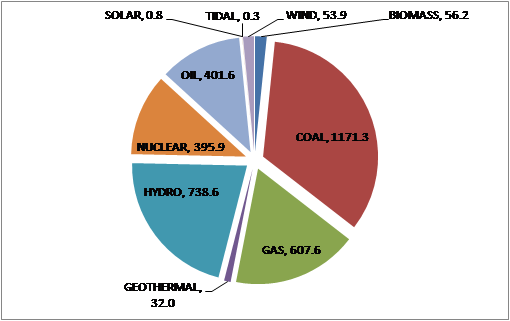
Figure: Existing Electricity Generation Capacity by Type in 2005 (Model base year), GW
New technologies
Key technology options
New electricity generation technologies are listed in Table.
Table: New technology options for electricity
| Technology Group | Model Technology Description |
| Coal | Atmospheric Fl Bed. |
| Air Blown IGCC. | |
| Oxygen Blown IGCC. | |
| Pressurized Fl Bed. | |
| Pulverized Coal. | |
| Gas | Gas Steam. |
| Fuel Cells. | |
| Dual gas / oil | Gas_Oil Comb Cycle. |
| Advanced Gas_Oil Turbine. | |
| Oil | Oil Steam. |
| Generic Dist Gen for Base Load. | |
| Generic Dist Gen for Peak Load. | |
| Nuclear | Advanced Nuclear. |
| Fusion Nuclear. | |
| Advanced Nuclear LWR. | |
| Advanced Nuclear PBMR. | |
| Hydro* | Generic Impoundment Hydro. |
| Generic Impoundment Hydro. | |
| Generic Impoundment Hydro. | |
| Generic Impoundment Hydro. | |
| Generic Impoundment Hydro. | |
| Generic ROR Hydro. | |
| Biomass | Crop Direct Combustion. |
| Crop Gasification. | |
| Biogas from Waste. | |
| MSW Direct Combustion. | |
| Sld Biomass Direct Combustion. | |
| Sld Biomass Gasification. | |
| Sld Biomass Direct Combustion.Decentralized | |
| Sld Biomass Gasification.Decentralized | |
| Geothermal | Shallow. |
| Deep. | |
| Very deep. | |
| Solar PV* | CEN.PV.T0 |
| CEN.PV. | |
| CEN.PV.T1 | |
| CEN.PV.T2 | |
| CEN.PV.T3 | |
| CEN.PV.T4 | |
| CEN.PV.T5 | |
| DCN.PV.T0 | |
| DCN.PV. | |
| DCN.PV.T1 | |
| DCN.PV.T2 | |
| PV.T3 | |
| PV.T4 | |
| PV.T5 | |
| Solar thermal | CEN.Thermal. |
| Wind* | CEN. |
| CEN.Offshore. | |
| CEN.Onshore. | |
| DCN.Onshore. |
- Different tranches of renewable technologies represent differences in the cost of resources (hydro) or quality of the resource (wind, solar).
An important element is the transformation element which allows for regional differences to be introduced without having to duplicate technologies. For the electricity sector, the following parameters are controlled, and varied by region:
- Costs parameters (INVCOST, FIXOM and VAROM). Operation and maintenance costs tend to be lower in developing regions, as do investment cost where those regions have a technology manufacturing base e.g. China.
- Technology discount rate set to 10%, except for solar technologies, where the rate is higher for some regions. Higher rates are typically used for developing regions.
- Seasonal AFs are set by region for solar technologies, accounting for different insolation values.
- Construction time is provided for hydro and nuclear technologies - 10 years for nuclear and hydro (dam) and 5 years for hydro (run-of-river). No differentiation is made between regions.
Further work is required to include new CHP technologies, which are not available for public system or industry investment.
An overview of the key parameters for the different technology groups is shown in below.
Table: Overview of technology characteristics by technology group (for WEU region)
| Technology Group | Efficiency % (range) | Investment cost $/kW (range) | Comment | ||
| 2005 | 2050 | 2005 | 2050 | ||
| Coal | 40-49 | 40-49 | 1430-1870 | 1265-1662 | |
| Gas / Dual | 37-57 | 37-57 | 360-1000 | 300-1000 | Lower cost and higher efficiency values represent combined cycle technology |
| Oil | 31-35 | 31-35 | 660-1045 | 660-1045 | |
| Nuclear | 1760-1870 | 1760-1870 | Fusion costs set at 3300 $/kW | ||
| Hydro | 1650-6050 | 1540-5400 | Five dam-based technologies reflecting different cost of resource | ||
| Biomass | 33-34 | 33-34 | 1870-2200 | 1870-2200 | MSW plant significantly higher at 3850 $/kW |
| Geothermal | 1925-2780 | 1650-2310 | Three geothermal technologies reflecting different cost of resource | ||
| Solar PV | 7150-11000 | 1485-3025 | Low cost is centralised plant and high cost decentralised plant. Technology resource tranched on basis of AFs | ||
| Solar thermal | 13321 | 13321 | Single technology with no evolution on costs | ||
| Wind | 1065-1650 | 880-1310 | One backstop, one offshore (CEN) and 2 onshore (one is CEN and one is DCN) technologies. Offshore tech. represents the high costs. |
Power plants with CCS technologies
For low carbon analyses, sequestration technologies in the electricity generation sector are very important. The first five technologies listed have vintages for 2010, 2020 and 2030.
Table: Overview of Power plant with CCS technology characteristics
| Model Technology Description | Investment cost ($/kW) | Efficiency (%) |
| NGCC+Oxyfueling | 950-1250 | 48-55 |
| NGCC+CO2 removal from flue gas | 800-1000 | 49-57 |
| IGCC+CO2 removal from input gas | 1800-2300 | 40-48 |
| Conventional Pulverized Coal+Oxyfueling | 1900-2400 | 37-44 |
| Conventional Pulverized Coal+CO2 removal from flue gas | 1850-2250 | 38-44 |
| SOFC (COAL) +CO2 removal - 2030 | 2200 | 48 |
| SOFC (GAS) +CO2 removal - 2020 | 1600 | 58 |
| Crop Direct Combustion. With CCS | 2125 | 33 |
| Crop Gasification.with CCS | 2500 | 34 |
| Sld Biomass Direct Combustion.with CCS | 1700 | 33 |
| Sld Biomass Gasification.with CCS | 2420 | 34 |
The fossil-based plants produce SNKELCCO2, a 'dummy' commodity which then goes to the different storage technologies. Biomass plants with sequestration produce SNKTOTCO2, differentiated as technologies that capture CO2 from the atmosphere (negative emissions). The range of storage technologies in the model are listed below.
Types of storage technologies
Removal by Enhanced Coalbed Meth recov <1000 m
Removal by Enhanced Coalbed Meth recov >1000 m
Removal by Depl gas fields (offshore)
Removal by Depl gas fields (onshore)
Removal by Storage in the deep ocean
Removal by Depl oil fields (offshore)
Removal by Depl oil fields (onshore)
Removal by Deep saline aquifers
Removal by Enhanced Oil Recovery
Mineralization for CO2 storage

