GHGs - REMIND-MAgPIE: Difference between revisions
Laura Delsa (talk | contribs) No edit summary |
m (Reverted edits by Mathijs Harmsen (talk) to last revision by Rineke Oostenrijk) Tag: Rollback |
||
| (14 intermediate revisions by 3 users not shown) | |||
| Line 1: | Line 1: | ||
{{ModelDocumentationTemplate | {{ModelDocumentationTemplate | ||
|IsEmpty=No | |IsEmpty=No | ||
|IsDocumentationOf=REMIND | |IsDocumentationOf=REMIND-MAgPIE | ||
|DocumentationCategory=GHGs | |DocumentationCategory=GHGs | ||
}} | }} | ||
REMIND simulates emissions from long-lived GHGs (CO2, CH4, N2O), short-lived GHGs (CO, NOx, VOC) and aerosols (SO2, BC, OC). REMIND accounts for these emissions with different levels of detail depending on the types and sources of emissions (see | REMIND-MAgPIE simulates emissions from long-lived GHGs (CO2, CH4, N2O), short-lived GHGs (CO, NOx, VOC) and aerosols (SO2, BC, OC). REMIND-MAgPIE accounts for these emissions with different levels of detail depending on the types and sources of emissions (see | ||
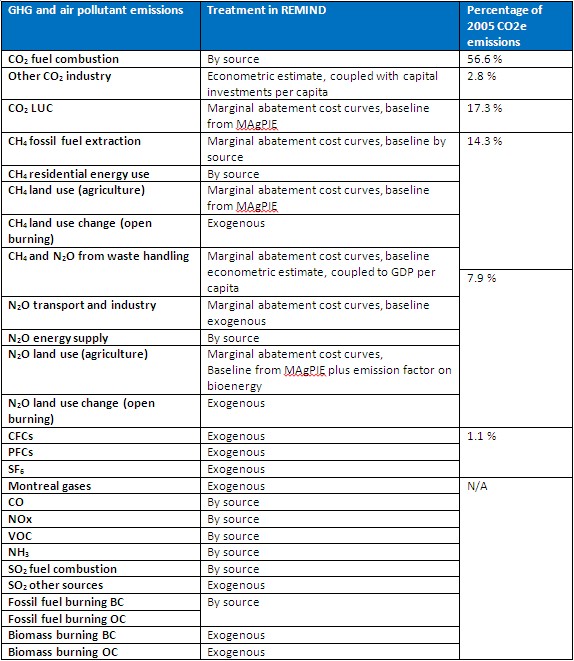
<xr id="tab:REMIND-MAgPIEtable_10"/>). It calculates CO2 emissions from fuel combustion, CH4 emissions from fossil fuel extraction and residential energy use and N2O emissions from energy supply based on sources. The energy system provides information on the regional consumption of fossil fuels and biomass for each time step and technology. For each fuel, region and technology, REMIND-MAgPIE applies specific emissions factors, which are calibrated to match base year GHG inventories <ref>EDGAR (2011) Global Emissions EDGAR v4.2. http://edgar.jrc.ec.europa.eu/overview.php?v=42. Accessed 25 Jan 2013</ref>. | |||
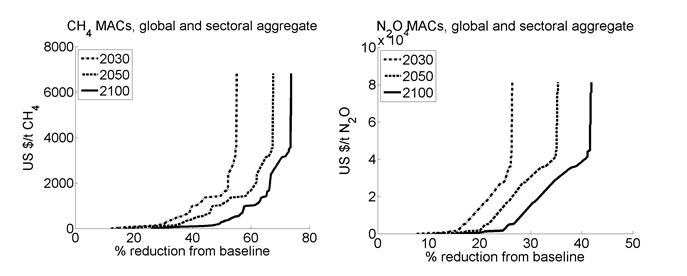
CH4, N2O, and CO2 from land-use change have mitigation options that are independent of energy consumption. However, costs are associated with these emissions. Therefore, REMIND derives the mitigation options from marginal abatement cost (MAC) curves, which describe the percentage of abated emissions as a function of the costs (see | CH4, N2O, and CO2 from land-use change have mitigation options that are independent of energy consumption. However, costs are associated with these emissions. Therefore, REMIND-MAgPIE derives the mitigation options from marginal abatement cost (MAC) curves, which describe the percentage of abated emissions as a function of the costs (see <xr id="fig:REMIND-MAgPIE_8"/>). It is possible to obtain baseline emissions - to which the MAC curves are applied - by three different methods: by source (as described above), by an econometric estimate, or exogenously. REMIND-MAgPIE uses the econometric estimate for CO2 emissions from cement production as well as CH4 and N2O emissions from waste handling. In both cases, the driver of emissions depends on the development of the GDP (as a proxy for waste production) or capital investment (as a proxy for cement production in infrastructure). REMIND-MAgPIE uses exogenous baselines for N2O emissions from transport and industry. | ||
Emissions of other GHGs (e.g. F-gases, Montreal gases) are exogenous and are taken from the SSP scenario data set from the IMAGE model (Van Vuuren et al. under review). REMIND does not represent abatement options for these gases; therefore, emissions from the corresponding SSP/RCP scenario best matching the target of the specific model simulation are used. | Emissions of other GHGs (e.g. F-gases, Montreal gases) are exogenous and are taken from the SSP scenario data set from the IMAGE model (Van Vuuren et al. under review). REMIND-MAgPIE does not represent abatement options for these gases; therefore, emissions from the corresponding SSP/RCP scenario best matching the target of the specific model simulation are used. | ||
[[File:GHGs - REMIND.PNG]] | <figure id="fig:REMIND-MAgPIE_8"> | ||
[[File:GHGs - REMIND-MAgPIE.PNG]] | |||
</figure> | |||
''' | '''Figure 1'''. Globally and sectorally aggregated abatement costs and potentials for CH4 (left panel) and N2O (right panel) for different points in time. Marginal abatement cost curves are shifted over time such that more abatement is possible and the same level of abatement is available for a lower price. Adapted from Strefler, et al. (2014). | ||
'''Table 1'''. Overview of the treatment of GHG and air pollutant emissions. | |||
<figtable id="tab:REMIND-MAgPIEtable_10"> | |||
[[File:54067658.jpg]] | [[File:54067658.jpg]] | ||
</figtable> | |||
<references /> | |||
Latest revision as of 18:18, 22 February 2023
| Corresponding documentation | |
|---|---|
| Previous versions | |
| Model information | |
| Model link | |
| Institution | Potsdam Institut für Klimafolgenforschung (PIK), Germany, https://www.pik-potsdam.de. |
| Solution concept | General equilibrium (closed economy)MAgPIE: partial equilibrium model of the agricultural sector; |
| Solution method | OptimizationMAgPIE: cost minimization; |
| Anticipation | |
REMIND-MAgPIE simulates emissions from long-lived GHGs (CO2, CH4, N2O), short-lived GHGs (CO, NOx, VOC) and aerosols (SO2, BC, OC). REMIND-MAgPIE accounts for these emissions with different levels of detail depending on the types and sources of emissions (see <xr id="tab:REMIND-MAgPIEtable_10"/>). It calculates CO2 emissions from fuel combustion, CH4 emissions from fossil fuel extraction and residential energy use and N2O emissions from energy supply based on sources. The energy system provides information on the regional consumption of fossil fuels and biomass for each time step and technology. For each fuel, region and technology, REMIND-MAgPIE applies specific emissions factors, which are calibrated to match base year GHG inventories [1].
CH4, N2O, and CO2 from land-use change have mitigation options that are independent of energy consumption. However, costs are associated with these emissions. Therefore, REMIND-MAgPIE derives the mitigation options from marginal abatement cost (MAC) curves, which describe the percentage of abated emissions as a function of the costs (see <xr id="fig:REMIND-MAgPIE_8"/>). It is possible to obtain baseline emissions - to which the MAC curves are applied - by three different methods: by source (as described above), by an econometric estimate, or exogenously. REMIND-MAgPIE uses the econometric estimate for CO2 emissions from cement production as well as CH4 and N2O emissions from waste handling. In both cases, the driver of emissions depends on the development of the GDP (as a proxy for waste production) or capital investment (as a proxy for cement production in infrastructure). REMIND-MAgPIE uses exogenous baselines for N2O emissions from transport and industry.
Emissions of other GHGs (e.g. F-gases, Montreal gases) are exogenous and are taken from the SSP scenario data set from the IMAGE model (Van Vuuren et al. under review). REMIND-MAgPIE does not represent abatement options for these gases; therefore, emissions from the corresponding SSP/RCP scenario best matching the target of the specific model simulation are used.
<figure id="fig:REMIND-MAgPIE_8">

Figure 1. Globally and sectorally aggregated abatement costs and potentials for CH4 (left panel) and N2O (right panel) for different points in time. Marginal abatement cost curves are shifted over time such that more abatement is possible and the same level of abatement is available for a lower price. Adapted from Strefler, et al. (2014).
Table 1. Overview of the treatment of GHG and air pollutant emissions.
<figtable id="tab:REMIND-MAgPIEtable_10">
 </figtable>
- ↑ EDGAR (2011) Global Emissions EDGAR v4.2. http://edgar.jrc.ec.europa.eu/overview.php?v=42. Accessed 25 Jan 2013