Electricity - REMIND-MAgPIE: Difference between revisions
Laura Delsa (talk | contribs) No edit summary |
Laura Delsa (talk | contribs) No edit summary |
||
| Line 86: | Line 86: | ||
'' * for ''joint production processes;'' '''<sup>§</sup>''' ''nuclear reactors with thermal efficiency of 33%; <sup>#</sup> technologies with exogenously improving efficiencies. 2005 values are represented by the lower end of the range. Long-term efficiencies (reached after 2045) are represented by high-end ranges.'' | '' * for ''joint production processes;'' '''<sup>§</sup>''' ''nuclear reactors with thermal efficiency of 33%; <sup>#</sup> technologies with exogenously improving efficiencies. 2005 values are represented by the lower end of the range. Long-term efficiencies (reached after 2045) are represented by high-end ranges.'' | ||
For variable renewable energies, we implemented two parameterized cost markup functions for storage and long-distance transmission grids - see Section Grid and Infrastructure. To represent the general need for flexibility even in a thermal power system, we included a further flexibility constraint based on Sullivan <ref>Sullivan | For variable renewable energies, we implemented two parameterized cost markup functions for storage and long-distance transmission grids - see Section Grid and Infrastructure. To represent the general need for flexibility even in a thermal power system, we included a further flexibility constraint based on Sullivan <ref>Sullivan P, Krey V, Riahi K (2013) Impacts of considering electric sector variability and reliability in the MESSAGE model. Energy Strategy Reviews 1:157–163. doi: 10.1016/j.esr.2013.01.001</ref>. | ||
The techno-economic parameters of power technologies used in the model are given in <xr id="tab:REMINDtable_5"/> for fuel-based technologies and <xr id="tab:REMINDtable_6"/> for non-biomass renewables. For wind, solar and hydro, capacity factors depend on grades, see Section Non-biomass renewables. | The techno-economic parameters of power technologies used in the model are given in <xr id="tab:REMINDtable_5"/> for fuel-based technologies and <xr id="tab:REMINDtable_6"/> for non-biomass renewables. For wind, solar and hydro, capacity factors depend on grades, see Section Non-biomass renewables. | ||
'''Table 3'''. Techno-economic characteristics of technologies based on non-biomass renewable energy sources <ref>Neij et al. | '''Table 3'''. Techno-economic characteristics of technologies based on non-biomass renewable energy sources <ref>Neij L, Andersen PD, Durstewitz M, et al (2003) Experience Curves: A Tool for Energy Policy Assessment (Extool Final Report). Lund University, Risø National Laboratory, ISET</ref>; <ref>Nitsch J, Krewitt W, Nast M, et al (2004) Ökologisch optimierter Ausbau der Nutzung erneuerbarer Energien in Deutschland (Kurzfassung). BMU, DLR, ifeu, Wuppertal Institut, Stuttgart, Heidelberg, Wuppertal</ref>; <ref>IEA (2007a) Energy Balances of OECD Countries. International Energy Agency, Paris</ref>; <ref>Junginger HM, Lako P, Lensink S, et al (2008) Technological learning in the energy sector. MNP</ref>; <ref>Pietzcker et al. 2014</ref>. | ||
<figtable id="tab:REMINDtable_6"> | <figtable id="tab:REMINDtable_6"> | ||
[[File:Remind Table 6.PNG]] | [[File:Remind Table 6.PNG]] | ||
</figtable> | </figtable> | ||
Revision as of 15:32, 3 February 2017
| Corresponding documentation | |
|---|---|
| Previous versions | |
| Model information | |
| Model link | |
| Institution | Potsdam Institut für Klimafolgenforschung (PIK), Germany, https://www.pik-potsdam.de. |
| Solution concept | General equilibrium (closed economy)MAgPIE: partial equilibrium model of the agricultural sector; |
| Solution method | OptimizationMAgPIE: cost minimization; |
| Anticipation | |
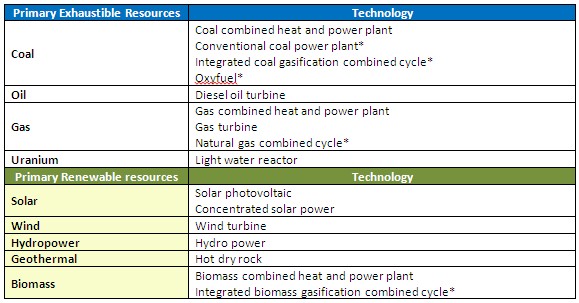
Around twenty electricity generation technologies are represented in REMIND, see <xr id="tab:REMIND_electricity_technologies"/>, with several low-carbon (CCS) and zero carbon options (nuclear and renewables).
Table 1. Energy Conversion Technologies for Electricity (Note: † indicates that technologies can be combined with CCS). <figtable id="tab:REMIND_electricity_technologies">
| Energy Carrier | Technology |
|---|---|
| Primary exhaustible resource | |
| Coal |
|
| Oil |
|
| Gas |
|
| Uranium |
|
| Primary renewable resource | |
| Solar |
|
| Wind |
|
| Hydropower |
|
| Biomass |
|
| Geothermal |
|
| Secondary energy type | |
| Hydrogen |
|
</figtable>
<figure id="fig:REMINDtable_4">
 </figure>
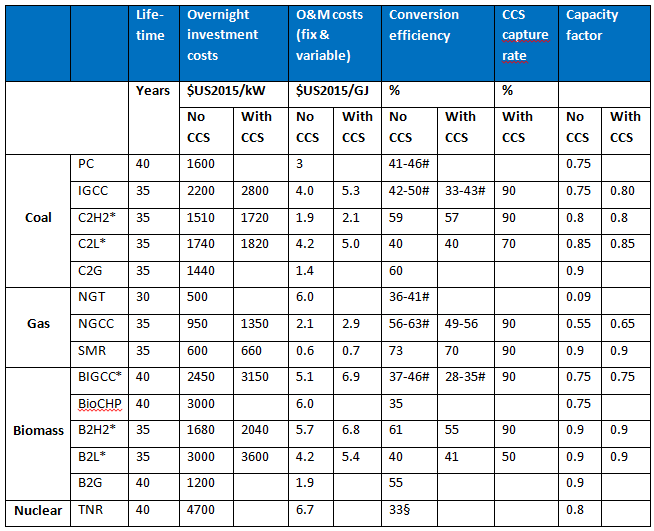
Table 2. Techno-economic characteristics of technologies based on exhaustible energy sources and biomass [1]; [2]; [3]; [4]; [5]; [6]; [7]; [8]; [9]; [10]; [11]; [12]; [13].
<figtable id="tab:REMINDtable_5">

Abbreviations: PC - pulverized coal, IGCC - integrated coal gasification combined cycle, CHP - coal combined heat and power plant, C2H2 - coal to hydrogen, C2L - coal to liquids, C2G - coal gasification, NGT - natural gas turbine, NGCC - natural gas combined cycle, SMR - steam methane reforming, BIGCC – Biomass IGCC, BioCHP – biomass combined heat and power, B2H2 – biomass to hydrogen, B2L – biomass to liquids, B2G – biogas, TNR - thermo-nuclear reactor; * for joint production processes; § nuclear reactors with thermal efficiency of 33%; # technologies with exogenously improving efficiencies. 2005 values are represented by the lower end of the range. Long-term efficiencies (reached after 2045) are represented by high-end ranges.
For variable renewable energies, we implemented two parameterized cost markup functions for storage and long-distance transmission grids - see Section Grid and Infrastructure. To represent the general need for flexibility even in a thermal power system, we included a further flexibility constraint based on Sullivan [14].
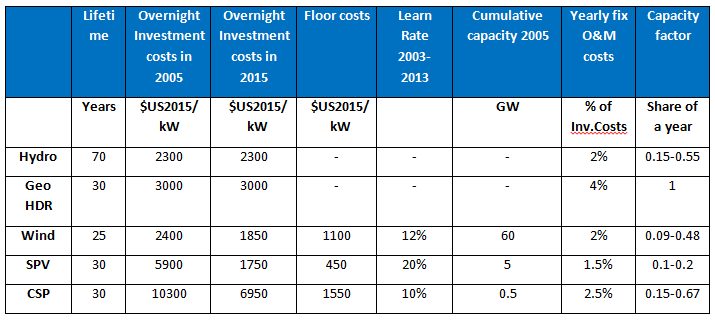
The techno-economic parameters of power technologies used in the model are given in <xr id="tab:REMINDtable_5"/> for fuel-based technologies and <xr id="tab:REMINDtable_6"/> for non-biomass renewables. For wind, solar and hydro, capacity factors depend on grades, see Section Non-biomass renewables.
Table 3. Techno-economic characteristics of technologies based on non-biomass renewable energy sources [15]; [16]; [17]; [18]; [19].
<figtable id="tab:REMINDtable_6">

- ↑ Iwasaki W (2003) A consideration of the economic efficiency of hydrogen production from biomass. International Journal of Hydrogen Energy 28:939–944
- ↑ Hamelinck C (2004) Outlook for advanced biofuels. Ph.D. Thesis, University of Utrecht
- ↑ Bauer N (2005) Carbon capture and sequestration: An option to buy time? Ph.D. Thesis, University of Potsdam
- ↑ Ansolabehere S, Beer J, Deutch J, et al (2007) The Future of Coal: An Interdisciplinary MIT Study. Massachusetts Institute of Technology, Cambridge, Massachusetts
- ↑ Gül T, Kypreos S, Barreto L (2007) Hydrogen and Biofuels – A Modelling Analysis of Competing Energy Carriers for Western Europe. In: Proceedings of the World Energy Congress “Energy Future in an Interdependent World”. 11–15 November 2007, Rome, Italy
- ↑ Ragettli M (2007) Cost outlook for the production of biofuels. Diploma Thesis, Swiss Federal Institute of Technology
- ↑ Schulz T (2007) Intermediate steps towards the 2000-Watt society in Switzerland: an energy-economic scenario analysis. PhD Thesis, Swiss Federal Institute of Technology (ETH)
- ↑ Uddin SN, Barreto L (2007) Biomass-fired cogeneration systems with CO2 capture and storage. Renewable Energy 32:1006–1019. doi: 10.1016/j.renene.2006.04.009
- ↑ Rubin ES, Chen C, Rao AB (2007) Cost and performance of fossil fuel power plants with CO2 capture and storage. Energy Policy 35:4444–4454. doi: 10.1016/j.enpol.2007.03.009
- ↑ Takeshita T, Yamaji K (2008) Important roles of Fischer-Tropsch synfuels in the global energy future. Energy Policy 36:2773–2784. doi: http://dx.doi.org/10.1016/j.enpol.2008.02.044
- ↑ Brown D, Gassner M, Fuchino T, Marechal F (2009) Thermo-economic analysis for the optimal conceptual design of biomass gasification energy conversion systems. Applied Thermal Engineering
- ↑ Klimantos P, Koukouzas N, Katsiadakis A, Kakaras E (2009) Air-blown biomass gasification combined cycles: System analysis and economic assessment. Energy 34:708–714
- ↑ Chen C, Rubin ES (2009) CO2 control technology effects on IGCC plant performance and cost. Energy Policy 37:915–924. doi: 10.1016/j.enpol.2008.09.093
- ↑ Sullivan P, Krey V, Riahi K (2013) Impacts of considering electric sector variability and reliability in the MESSAGE model. Energy Strategy Reviews 1:157–163. doi: 10.1016/j.esr.2013.01.001
- ↑ Neij L, Andersen PD, Durstewitz M, et al (2003) Experience Curves: A Tool for Energy Policy Assessment (Extool Final Report). Lund University, Risø National Laboratory, ISET
- ↑ Nitsch J, Krewitt W, Nast M, et al (2004) Ökologisch optimierter Ausbau der Nutzung erneuerbarer Energien in Deutschland (Kurzfassung). BMU, DLR, ifeu, Wuppertal Institut, Stuttgart, Heidelberg, Wuppertal
- ↑ IEA (2007a) Energy Balances of OECD Countries. International Energy Agency, Paris
- ↑ Junginger HM, Lako P, Lensink S, et al (2008) Technological learning in the energy sector. MNP
- ↑ Pietzcker et al. 2014