Population - DNE21+
| Corresponding documentation | |
|---|---|
| Previous versions | |
| Model information | |
| Model link | |
| Institution | Research Institute of Innovative Technology for the Earth (RITE), Japan, http://www.rite.or.jp/en/. |
| Solution concept | |
| Solution method | |
| Anticipation | |
The primary drivers of future energy demand in DNE21+ are projections of population and GDP at market exchange rate (MER). We developed two different prospects as they may more or less likely take place in the future as macroeconomic trends, considering from the past statistics. In Scenario A, slow economic growth slows down after the miraculous past growth mainly in developed countries In Scenario B, technological advances keep ongoing as in the past and per capita GDP continues to grow quite rapidly. As a reference case, we usually refer to Scenario A, but it depends on scope and purpose of analysis.
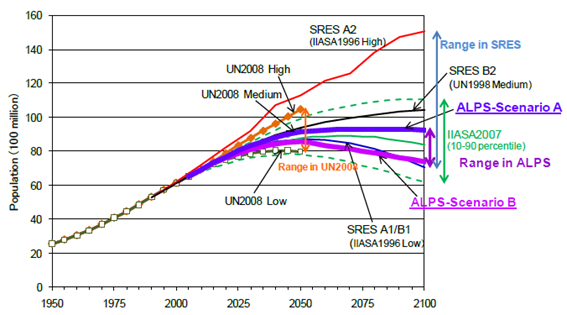
The world population scenarios were developed with reference to The UN Population Division; World Population Prospects (The 2008 Revision) which have been used worldwide. UN scenarios of the world population are developed every two years and have been revised downward for every update. Therefore, in this scenario, even after taking account of the future population increase in developing countries such as in Asia or Africa, we assume it very unlikely that the future world population will be substantially over 10 billion. Historical statistics explicitly show the trends that the fertility and population growth rates become lower with growing GDP per capita. Our population scenario is developed, assuming this trend to keep in the future, by replacing the relationship between fertility and per capita GDP by the relationship between annual change rate of population and per capita GDP. The population growth in Scenario B is assumed to be smaller than that in Scenario A, as per capita GDP is larger in Scenario B.
Figure 3 shows the world population scenarios. In Scenario A, the world population is assumed to have a medium growth rate and the UN medium variant scenario of the world population, the 2008 Revision is adopted. After growing to 9.1 billion in 2050, the world population grows steadily to 9.3 billion by the year 2100. In Scenario B, the world population is assumed to have a low growth rate. This scenario is roughly equivalent to the average of UN medium variant and low variant scenarios of the world population, the 2008 Revision. The world population grows slowly from 6.1 billion in 2000. After peaking at 8.6 billion around 2050, it declines to 7.4 billion by the year 2100.
Figure 3 Population Scenario
In terms of GDP per capita, the following distinct trends are observed historically.
- The growth rate of GDP per capita is low in the least developed countries (LDCs).
- When GDP per capita is between a few hundred dollars and a thousand dollars, the growth rate of GDP per capita tends to become high.
- For the higher GDP per capita, the growth rate tends to decrease gradually, shifting toward moderate economic growth.
- The industrial structure has three big trends; in the first period the structure centers in primary industry, in high economic growth period heavy industry develops starting from light industry, and in gradual growth period the tertiary industry starts to grow such as service and information industries.
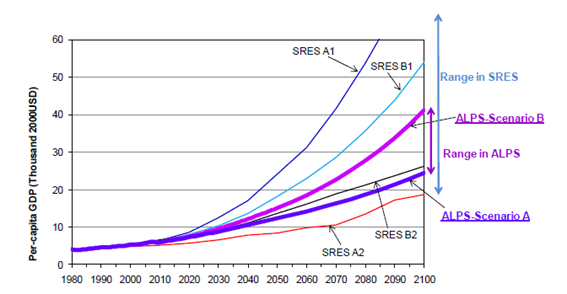
Based on these observations, GDP (MER) per capita scenarios are developed as shown Figure 4. In Scenario A, the current developed countries slow down the GDP per capita growth until 2100 and the growth rate converges to 0.5% per year in 2100. Developing countries continue to grow steadily. The current emerging economies and least developed countries have the per capita GDP growth rates of around 1%/year and around 2%/year in 2100, respectively. The global average growth rate from 2000 to 2100 is 1.5% per year.
In Scenario B, the current developed countries continue to increase GDP per capita by 1.0%/year in 2100. Developing countries continue to grow rapidly. The current emerging economies and least developed countries grow at the rate of around 2%/year and around 3%/year even in 2100, respectively. The global average growth rate from 2000 to 2100 is 2.1% per year.
Both in Scenario A and B, economic gaps between developed and developing countries narrow steadily until 2100. Yet, the gaps in Scenario B are still bigger than in Scenario A. The GDP per capita ratio of OECD90 to Africa is 38.5 in 2000, and in 2100 6.4 in Scenario A and 6.7 in Scenario B.
Figure 4 per capita GDP Scenario
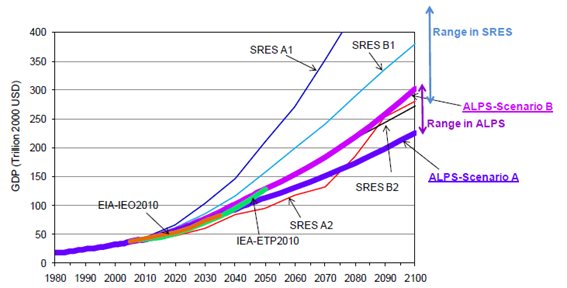
GDP scenarios are formulated by combination population scenario and per capita GDP scenario. Figure 8 shows the world GDP scenarios. The potential world GDP grows at a higher rate in Scenario B than in Scenario A. As mentioned above, GDP per capita growth at a higher rate in Scenario B makes the population smaller than the population in Scenario A, so that GDP difference between the two scenarios shrinks. The world average of GDP annual growth is assumed to be 2.0% per year in Scenario A and 2.3% per year in Scenario B from 2000 to 2100.
Figure 5 GDP (MER) Scenarios


