Population - TIAM-UCL: Difference between revisions
No edit summary |
No edit summary |
||
| Line 15: | Line 15: | ||
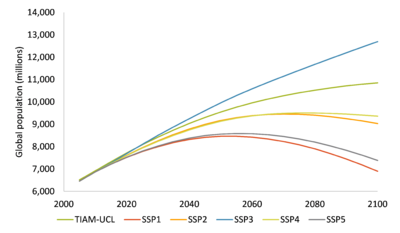
We are also able to run the various Shared Socio-economic (SSP) pathway scenarios [[CiteRef::nakicenovic2014a]] in TIAM-UCL. The standard TIAM-UCL population assumption is around halfway between SSP3 and SSP2 for population. | We are also able to run the various Shared Socio-economic (SSP) pathway scenarios [[CiteRef::nakicenovic2014a]] in TIAM-UCL. The standard TIAM-UCL population assumption is around halfway between SSP3 and SSP2 for population. | ||
<figure id="fig:Population SSPs"> | |||
[[File:Pop vs SSPs.png|400px|<caption>TIAM-UCL population vs SSPs</caption>]] | |||
</figure> | |||
=== Households === | === Households === | ||
Revision as of 20:00, 15 December 2016
| Corresponding documentation | |
|---|---|
| Previous versions | |
| Model information | |
| Model link | |
| Institution | University College London (UCL), UK, https://www.ucl.ac.uk. |
| Solution concept | Partial equilibrium (price elastic demand) |
| Solution method | Linear optimisation |
| Anticipation | Perfect Foresight
(Stochastic and myopic runs are also possible) |
Population
Population figures up to 2050 are based on UN estimations (UN, 2009). It is assumed that world population will increase from 6.7 billion people in 2005 to 9.3 billion people in 2050, reach the peak in 2090 with 9.8 billion and then decline slightly.
The biggest population increase over the 21st century is expected to happen in Africa, India, Other Developing Asia and the Middle East .
Under the given assumptions China, Eastern Europe, Former Soviet Union, Japan, Mexico, South Korea and Western Europe experience negative population growth rates in the second half of the 21st century.
Especially for South Korea and Japan, it is assumed that the population will shrink significantly over the course of the 21st century.
We are also able to run the various Shared Socio-economic (SSP) pathway scenarios nakicenovic2014a in TIAM-UCL. The standard TIAM-UCL population assumption is around halfway between SSP3 and SSP2 for population.
<figure id="fig:Population SSPs">
 </figure>
Households
The growth rate of household numbers during 2005-2100 for different regions are represented in the model. The number of households is based on population estimates and occupancy rate. There exists no database for the occupancy rate for each region in the TIAM-UCL model.
Therefore, the numbers in this section rely on national statistics. For some countries, there exist forecasts for the near future (up to 2030) concerning the development of the average number of people in a household. These have been used where available in order to determine the household growth for the near future.
For the longer term, it is assumed that the occupancy rate will increase in line with historic data from 1.7 to 3 persons per household, depending on the region. The reason for this range is the difference in current average persons per household, e.g. in 2005 the average Indian household consisted of 5.3 persons, while the average Western European household consisted of 2.1 persons per household.
In order to simplify the data needed for the calculation, characteristic countries have been chosen for regions that consist of more than two countries. Those are South Africa for Africa, Brazil for Central and South America, Poland for Eastern Europe, Russia for Former Soviet Union, Iran for Middle East, Indonesia for Other Developing Asia and Germany for Western Europe. Numbers for the driver 'GDP per household' have been calculated as the ratio of GDP and number of households for each given region.