Spatial dimension - IMAGE
| Corresponding documentation | |
|---|---|
| Previous versions | |
| Model information | |
| Model link | |
| Institution | PBL Netherlands Environmental Assessment Agency (PBL), Netherlands, https://www.pbl.nl/en. |
| Solution concept | Partial equilibrium (price elastic demand) |
| Solution method | Simulation |
| Anticipation | Simulation modelling framework, without foresight. However, a simplified version of the energy/climate part of the model (called FAIR) can be run prior to running the framework to obtain data for climate policy simulations. |
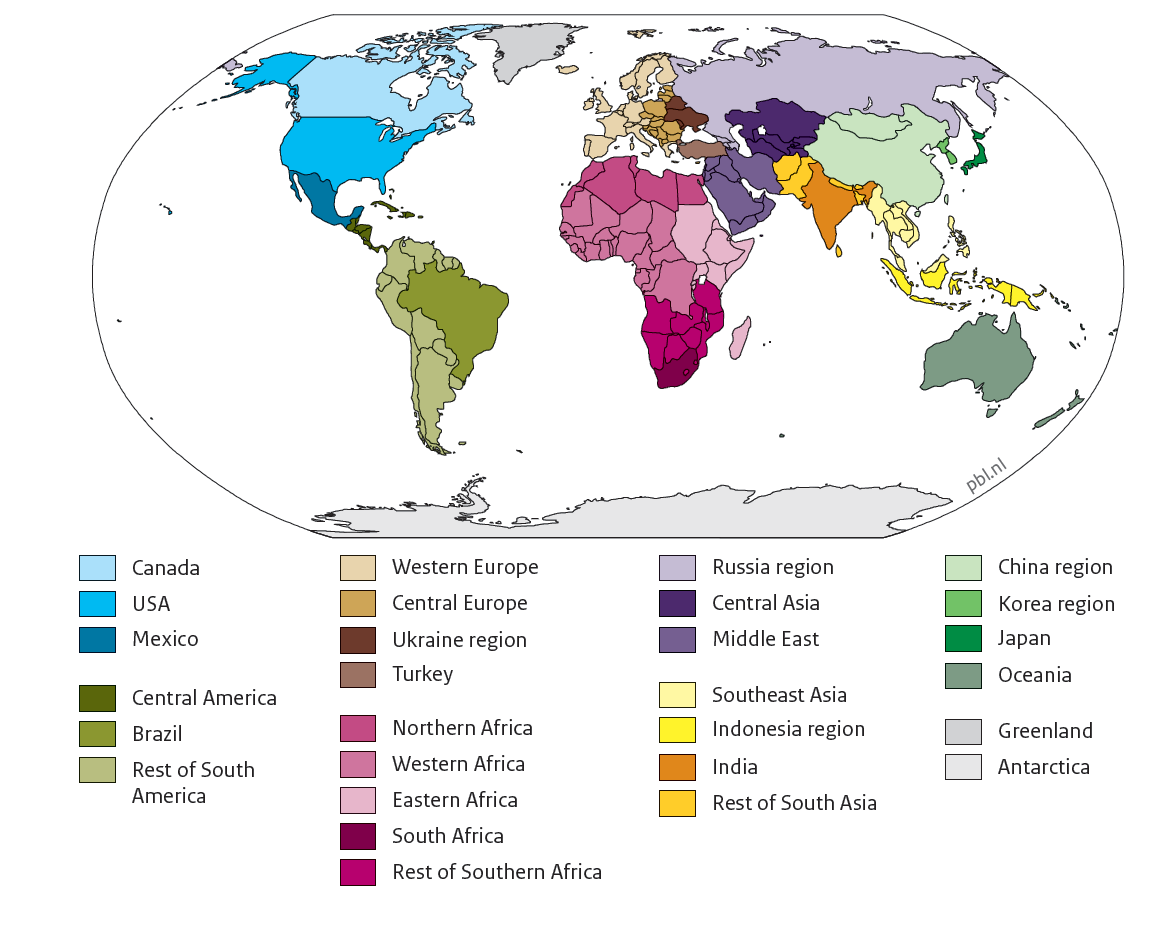
The Human system and the Earth system in IMAGE 3.0 are specified according to their key dynamics. The geographical resolution for socio-economic processes is 26 regions defined based on their relevance for global environmental and/or development issues, and the relatively high degree of coherence within these regions (figure below). In the Earth system, land use and land-use changes are presented on a grid of 5x5 minutes, while the processes for plant growth, carbon and water cycles are modelled on a 30x30 minutes resolution.
Trade
The following products are traded in the IMAGE framework: energy carriers (fossil fuels, biomass and hydrogen), CO2 certificates, steel and cement, crops and livestock products (not the livestock itself). The way trade is modeled differs by product. In the energy system, trade is described by assuming that each region for import and export products to every other region; allocation is done using multinomial logit functions that assign market share on the basis of the costs of the product, the costs of transport and a preference factor. The trade of agricultural products is determined using a computable general equilibrium model (CGE) called MAGNET that is coupled to IMAGE.
Spillovers
Several relationships exists between the IMAGE regions that can result in spillovers. As described in the previous paragraph, the IMAGE regions are coupled via trade. This implies that policies introduced in one region can influence trends in another region. This is the case for energy products, but also for land-use products. While the first can directly influence emissions, the latter can impacts land use and therefore indirectly emissions. In the model, policies can also lead to spill-over of technologies on the basis of the learning curves in the model. However, the impact of this is relatively weak in IMAGE.
Figure 1.2: The 26 world regions in IMAGE 3.0 (from IMAGE 3.0 documentation)
A brief overview is presented here, for more information see theIMAGE 3.0 web page.
