Energy demand - IMAGE
| Corresponding documentation | |
|---|---|
| Previous versions | |
| Model information | |
| Model link | |
| Institution | PBL Netherlands Environmental Assessment Agency (PBL), Netherlands, https://www.pbl.nl/en. |
| Solution concept | Partial equilibrium (price elastic demand) |
| Solution method | Simulation |
| Anticipation | Simulation modelling framework, without foresight. However, a simplified version of the energy/climate part of the model (called FAIR) can be run prior to running the framework to obtain data for climate policy simulations. |
Demand is calculated in terms of physical parameters (EJ, tons of grains etc). The demand types represented include energy, agricultural products, and water. Also for timber there is a relatively simple representation. For residential energy use income and urban/rural distribution are taken into account.
Energy demand
Global energy use has increased rapidly since the industrial revolution. For a historical perspective, most increases have occurred in high-income regions but more recently, the largest increase is in emerging economies. With the aspirations for income growth in medium- and low-income countries, energy demand is to be expected to grow in the coming decades, with major implications for sustainability.
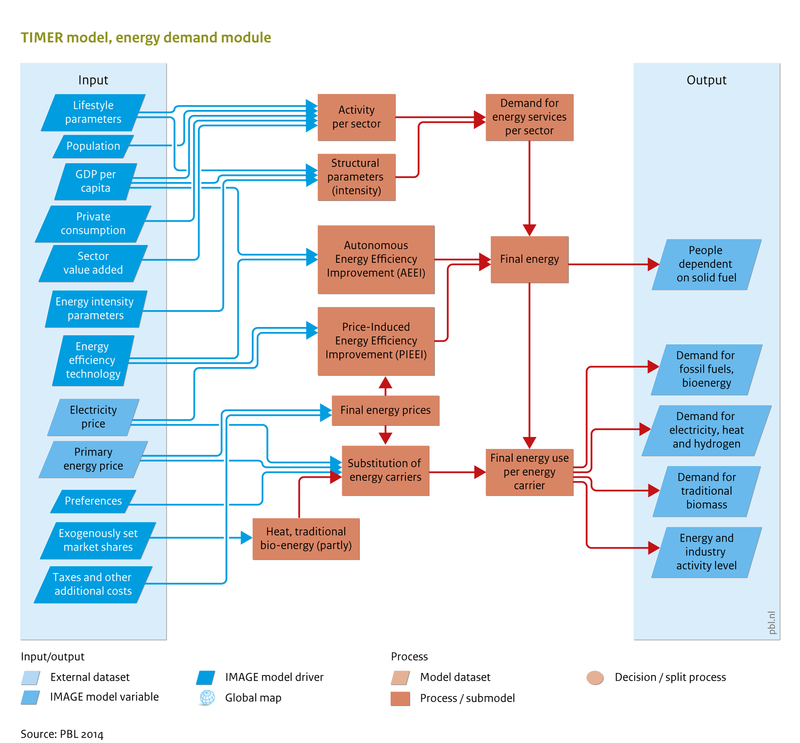
In the TIMER energy demand module, final energy demand is simulated as a function of changes in population, economic activity and energy intensity. Five economic sectors are considered: industry; transport; residential; public and private services; and other sectors mainly agriculture. In each sector, final energy use is driven by the demand for energy services, such as motor drive, mass displacement, chemical conversions, lighting, heating and cooling. Energy demand is considered as a function of three groups of parameters and processes:
- activity data, for example on population and income, and more explicit activity indicators, such as steel production;
- long-term trends that determine the intensity of use, for example, economic structural change (SC), autonomous energy efficiency improvement (AEEI) and price-induced energy efficiency improvement (PIEEI);
- price-based fuel substitution (the choice of energy carrier on the basis of its relative costs).
These factors are implemented in different ways in the various sectors. In some sectors, a detailed end-use service-oriented modelling approach is used while in other sectors, the description is more generic and aggregate. The detailed energy end use models are described in the IMAGE energy section. Energy prices link the demand module with other parts of the energy model, as they respond dynamically to changes in demand, supply and conversion.
The energy demand module has aggregated formulations for some sectors and more detailed formulations for other sectors. In the description that follows, the generic model is presented which is used for the service sector, part of the industry sector (light) and in the category other sectors. Next, the more technology detailed sectors of residential energy use, heavy industry and transport are discussed in relation to the elements of the generic model. In the generic module, demand for final energy is calculated for each region (R), sector (S) and energy form (F, heat or electricity) according to:
in which:
- represents final energy;
- represents population;
- the sectoral activity per capita;
- a factor capturing intra-sectoral structural change;
- the autonomous energy efficiency improvement;
- the price-induced energy efficiency improvement.
In the denominator:
- is the end-use efficiency of energy carriers used, for example in boilers and stoves; and
- represents the share of each energy carrier.
Population and economic activity levels are exogenous inputs into the module.
An overview of the energy demand model structure is provided in <xr id="fig:Energy demand"/>.
<figure id="fig:Energy demand">
</figure>


